The frequency of maintenance dredging work is determined by the net difference between inflow and outflow of suspended sediment particles. Port and waterway authorities are looking for methods to increase the accessibility of navigation channels and reduce dredging effort.
One of the options to improve both aspects is navigation through loose mud layers. To allow ships to enter in loose mud layers the characteristics of the mud layers need to be well known and monitored. Another option is to actively change the balance between inflow and outflow of sediments by selectively reducing or increasing the resistance against bottom sediment erosion or by deviating water currents. This article covers some basic sediment agitation techniques and practical field test data demonstrating the long and short term effects on sediment strength in the Port of Rotterdam. The article also proposes measurement and evaluation tools to follow up the agitated sediment zones in time and space enabling the prediction of sediment consolidation and related strength.
Introduction
In many ports, access channels and waterways, siltation or sedimentation processes reduce navigable depth (PIANC-IAPH-IMPA-IALA, 1997, PIANC, 2008). Port and waterway authorities apply a range of techniques to reduce siltation or restore navigable depth in ports and waterways. These techniques range from adopting specific construction design rules to water injection dredging and trailing suction hopper dredging (PIANC, 2008, PIANC, 2013). In recent years, series of dredging experiments were performed in the Netherlands, ports active in these experiments were Zeeland Seaports (Zeeland Seaports, 2012), Groningen Seaports (Kamphuis, 2013) and Port of Rotterdam (Staelens, 2013). All projects aimed at reducing dredging cost by either changing dredging methodology or dredging strategy or a combination of both methodology and strategy. The consolidation behavior of the Beerkanaal soft cohesive sediment was first simulated and parameterized in a full scale test facility (Staelens, 2013), these simulations were followed by full scale field experiments. This article will cover the trailing suction hopper dredging and water injection dredging tests performed in the Port of Rotterdam Beerkanaal during calendar year 2013. The location of the test and reference zones is given in Figure 1.
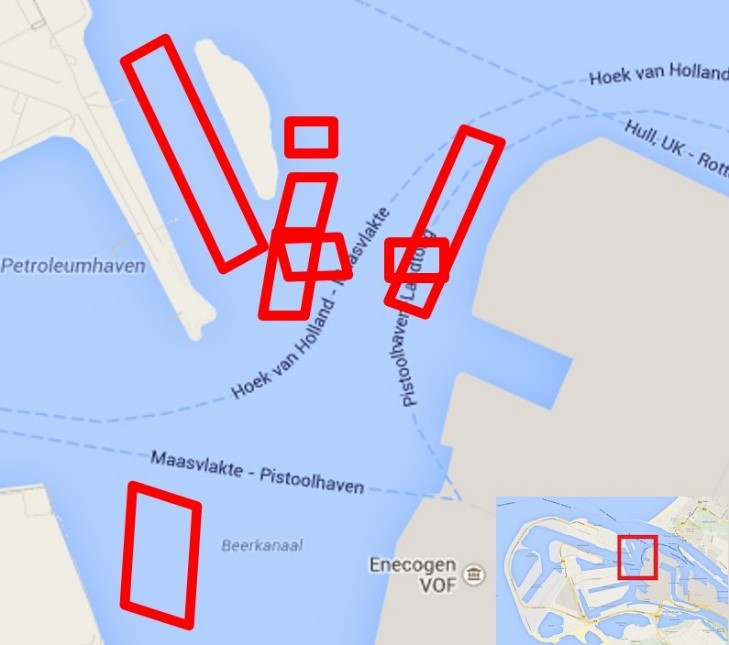
Figure 1 – Localization of the dredging test zones and consolidation reference zones
The agitation and consolidation simulations performed on large pressurized consolidation columns in 2012 (Staelens, 2013), demonstrated the Beerkanaal sediment has a potential of remaining loose for long periods of time. The premise for having long time constants in the sediment strength increase, is to generate thick stationary fluidized sediment layers or fluid mud. Initially the goal of this research programme was to investigate what dredging methodologies could be used on the field to make the sediment loose, stationary and navigable for weeks or months. The test results demonstrate what methodologies are suitable, not only to loosen sediment, but also to restore the erosion-deposition equilibrium.
8 test areas within the Beerkanaal, Port of Rotterdam were selected, 2 of them were used as dredging test area. Five dredging tests were performed, two trailing suction hopper dredger tests and three water injection dredging tests. The areas were evaluated using multi beam echo sounder delivering bathymetry maps and GraviProbe drops (Geirnaert, 2013, Kamphuis, 2013, Stark, 2014, Staelens, 2013, Wever, 2014) delivering sediment strength data. All measurements were executed before the dredging test and regularly after the test delivering a time series measurements on each experiment. The experiments demonstrate that making the sediment loose is possible with both dredging methods, but making sediment stationary can be very difficult.
Methods
Dredging methods
The goal of this research was to find a method to generate navigable stationary fluid mud. Two dredging methods were thought to have potential: (1) Water Injection Dredging (WID) and (2) Trailing Suction Hopper Dredging (TSHD).
Measurement methods
Water injection dredgers inject high volumes of water at low pressure (100 kPa) (ref). Hence a measurement system capable of measuring penetration resistance in cohesive sediment up to 100 kPa is necessary to evaluate the potential of the cohesive sediment to be fluidized. A combination of multi beam echo sounder bathymetry and Graviprobe measurements were conducted each time before and multiple times after a dredging experiment drops (Geirnaert, 2013, Kamphuis, 2013, Stark, 2014, Staelens, 2013, Wever, 2014). The multi beam echo sounder delivered a digital terrain model under which a sediment strength volume was interpolated between centimetre strength data derived from Graviprobe drops. The Graviprobe is a 7.8 kg free fall penetrometer equipped with on board accelerometers and pressure sensors. Deceleration data is gridded in 1 cm depth bins, a drag force correction is applied and sediment penetration resistance data is calculated. Unlike many other hydrographic instruments, the Graviprobe, due to its high impact velocity and small impact surface (20cm²), is capable of collecting high quality strength data up to 100 kPa and higher cone penetration resistances while still be capable of intruding deep into high density consolidated sediment layers.
Results
In the selected test regions, the consolidated sediment cone penetration resistance did not exceed 100 kPa. These low penetration resistances indicate that a water injection dredger, injecting water at a pressure difference of 100 kPa, will have the capabilities to mobilize, liquefy or cut the consolidated cohesive sediment. Water injection and trailing suction hopper dredging tests were executed in sedimentological and geotechnical comparable regions in an attempt to generate stationary fluid mud.
Water Injection Dredging (WID)
WID test 1 started 2013/04/03 south east of the Achtste Petroleumhaven in the Beerkanaal (Figure 2).
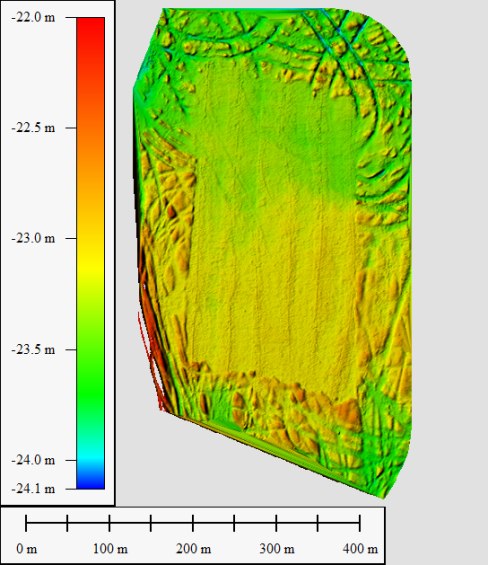
Figure 2: WID test 1, 1 meter of stationary fluidized mud was generated in situ
Surface smoothing due to the water injection is clearly visible on the multi beam echo sounder bathymetry. In order to visualize the effect of the water injection dredging experiment on the sediment strength below the surface and to have an idea of the influence depth of the water injection, a matrix of Graviprobe drops was taken in the influenced zone. Cone penetration resistance is measured at t0 (2013/03/12), t1 (2013/04/04), t2 (2013/04/10), t3 (2013/04/26), t4 (2013/05/07). A surface of 200 meter by 400 meter was injected and liquefied. A layer of 0.8 meter to 1 meter of mud appears to be affected by the water injection.
Figure 3 displays strength increase of the sediment through time.
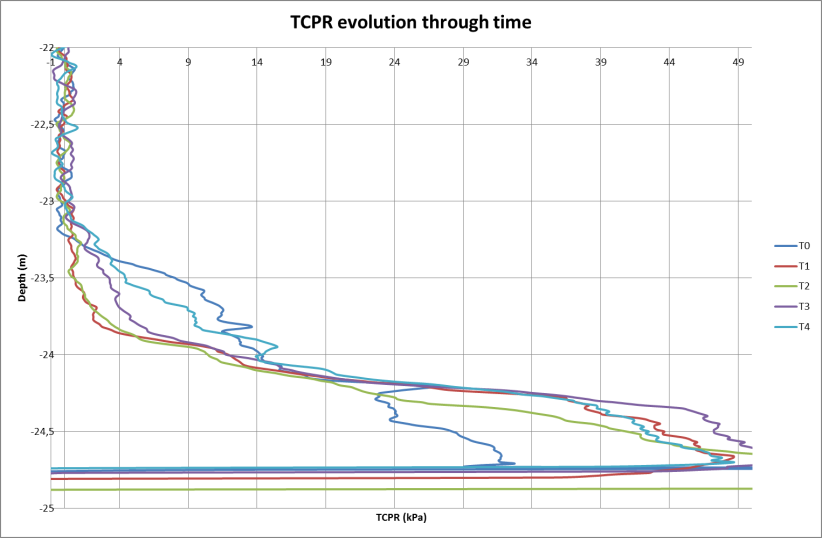
Figure 3: Time evolution of the cone penetration resistance during the consolidation process of WID test 1
The strength increase follows similar trends as observed during the full scale experiments in a controlled environment described in Staelens (2013). One month after the experiment the sediment strength has not fully recovered yet. Before starting WID test 2, a trailing hopper suction dredger dredged some lines through the WID test 1 zone (Figure 4).
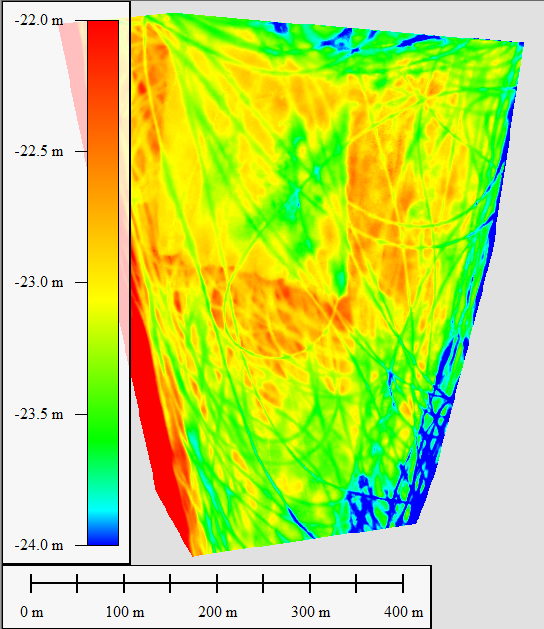
Figure 4: WID test 1 is still visible on the bathymetry map, THSD tracks were drawn through the test area. The fuzzy boundaries of the THSD tracks indicate that the strength of the sediment in the test area did not recover yet.
The dredger tracks in that area appear to collapse more than in the region around the zone, indicating that the sediment strength reduction can also be visualized using a multi beam echo sounder. The fluidized mud remained stationary. Figure 4 displays the experiment zone at t4, just before the second experiment was conducted, an erosive zone is clearly visible on the right side of the test area.
WID test 2 started 2013/05/29 south east of the Achtste Petroleumhaven in the Beerkanaal. Cone penetration resistance was measured at t0 (2013/05/28), t1 (2013/05/30), t2 (2013/06/06), t3 (2013/06/12), t4 (2013/06/27).
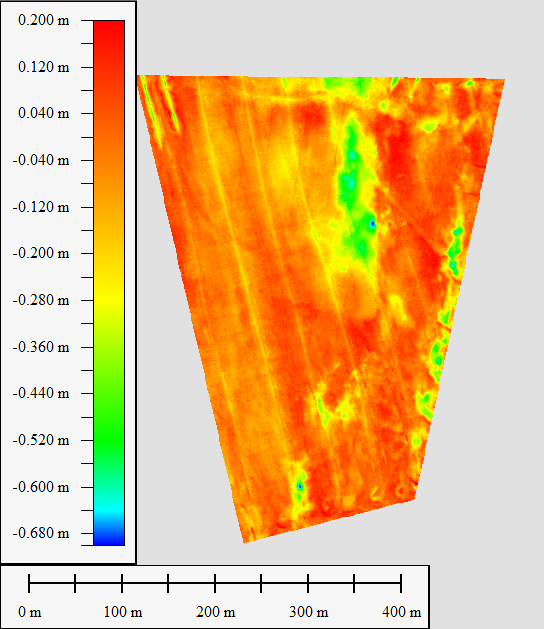
Figure 5: WID test 2 multi beam echo sounder bathymetry
A layer of 1 meter to 1.5 meter of mud appeared to be affected by the water injection in the region where WID test 1 was executed (Figure 6), outside the region of WID test 1 the layer of affected mud was 0.8 meter to 1 meter thick.
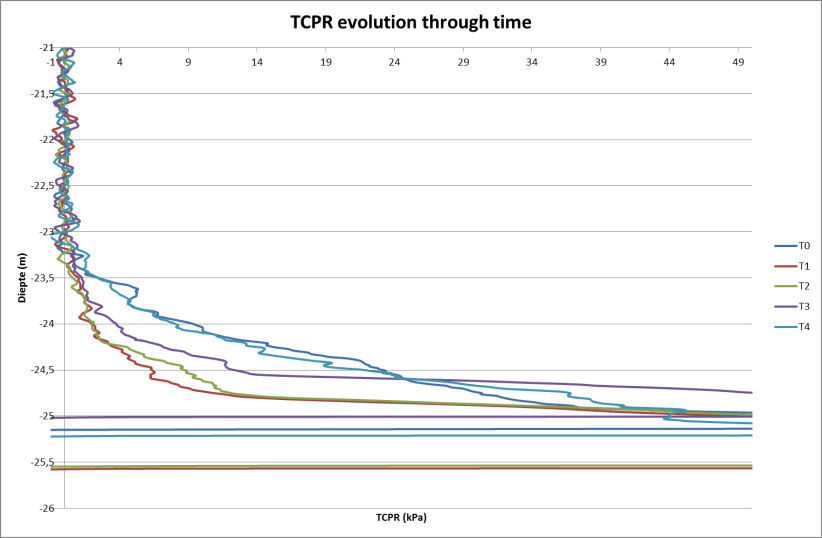
Figure 6: Time evolution of the cone penetration resistance during the consolidation process of WID test 2
Trailing Suction Hopper Dredging (TSHD)
TSHD test 1 was executed 2013/03/12 east of the Nijlhaven. Cohesive sediment was dredged and released immediately from the pump into the water column. The sediment as such was placed back. The sediment was not diluted during the test. The sediment strength in the dredged zone was evaluated. No significant decrease of strength was observed on any of the Graviprobe drops, Figure 7 is a typical example.
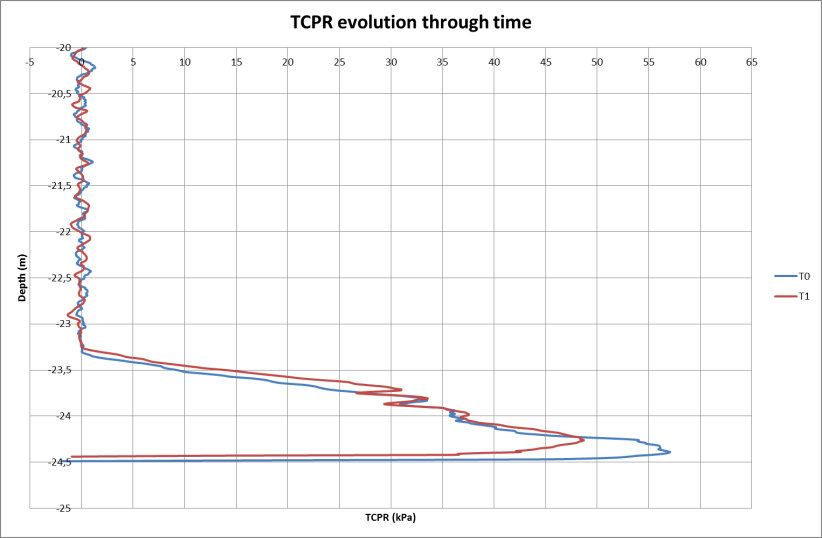
Figure 7: Total cone penetration resistance before (blue) and after (red) the TSHD dredging test
TSHD test 2 started 2013/04/16 east of the Nijlhaven. Cohesive sediment was dredged and in the pump water was injected in the sediment after which the sediment was released in the water column. The fluidized sediment did not settle to become stationary. No stationary fluid mud was observed on the multi beam echosounder data (Figure 8) or on the Graviprobe data. Clearly all fluidized sediment was mobilized.

Figure 8: Depth difference map of TSHD 2 test
Discussion
Fluidizing sediment requires water injection and optionally it requires stirring. The stirring test using a TSHD pump on heavily consolidated cohesive sediment did not affect the strength of that cohesive sediment. How the water is injected is of no importance. A TSHD can add water on several points in the circuit: (1) in the trailing head by use of the nozzles, (2) in the suction pump or (3) in the hopper. A WID injects water directly in the seafloor, depending on the characteristics of the seafloor the influence zone and effectiveness of the injected water can be estimated (PIANC, 2013).
When the sediment is liquefied, hydrodynamic conditions and bathymetry may have a significant influence on how the fluidized sediment behaves. Fluidized sediment mobilizes on slopes (PIANC, 2013) and in regions with bottom currents exceeding 1m/s. Hence successful tests were performed in flat bathymetric areas with limited water current velocities. Erosion was observed on the bathymetric data after all WID tests.
The initial expectation was that the TSHD liquefaction process would be more controllable than the WID liquefaction process. That expectation proved to be incorrect, no reasonable explanation has been found for this. The WID is capable of repeatedly generating both gravity flows (PIANC, 2013) as stationary fluid mud.
The sediment strength in the WID test 1 area did not fully recover yet after 50 days, which was made visible in the bathymetry after passing through the area with a TSHD and by Graviprobe drops before and after WID test 2. WID test 2 was more effective in the WID test 1 area, confirming the observations in the full scale simulator (Staelens, 2013).
We presented that the potential of a WID on soft cohesive sediment can be visualized and planning estimates can be made using the Graviprobe free fall penetrometer.
Conclusion
The goal of the field tests was to evaluate two dredging methods and their respective capabilities to generate in-situ stationary fluid mud. Two trailing suction hopper dredger (TSHD) failed to generate stationary fluid mud. The first test failed because the mud was not diluted with water, the second test failed because the sediment was diluted with water and released too high in the water column. During the second TSHD test all sediment was transported by the water, away from the test area. The observed phenomenon of transport of large volumes of sediments may give rise to new dredging approaches. The water injection dredger (WID) passed two tests successfully. Since pumping water requires less energy than pumping cohesive sediment, and the platform itself is much smaller than a TSHD, it is not only the most cost effective method but also the CO2 friendliest method to liquefy and transport sediment. Considering the fact that the WID is capable of liquefying most of the sediment in the Beerkanaal and the ease of mobilisation of fluid mud by the water currents, new cost effective and CO2 friendly port maintenance dredging tools and strategies may emerge soon but require further and larger scale in-situ testing and evaluation.